![]()
The Tioga DataSplash documentation contains a number of tutorials (tours). We suggest starting with the Quick Tour.
 |
Quick Tour:
30 Minutes
In this hands-on demonstration, you'll navigate in a sample visualization and create splash objects in just 30 short minutes! Includes screen shots for web surfers! |
In addition to the quick tour, we provide a series of tours in which you can build an example DataSplash visualization from the ground up. These tours teach you all the tools you need to create your own visualizations using DataSplash.
The only tour in this series which is currently available is the Splash Tour.
![]() The other tours
are all under construction!
The other tours
are all under construction!
If you take the tours in the order they are presented below, you may start a new visualization of your own and build on it continuously. When you finish the final tour, you will have built a complete visualization.
You can also take the tours in any order you choose. To facilitate this, we have included pre-constructed DataSplash visualizations which represent the various starting points of each tour. If you only have time for a few of the tours, we recommend the Splash, Layer, and Portal tours in that order of importance.
All tours make reference to the Getting Started document. You don't need to read this document separately - just keep it handy and refer to it as instructed. Other than that, the tours are completely self-contained and are designed for use as either html or printed documents.
 |
A DataSplash visualization is called a canvas. Each canvas can contain multiple layers. This tour teaches you how to begin a new canvas and share layers from other DataSplash visualizations. |
 |
This tour teaches you to visually program layers to interact with the navigation system. |
 |
Need a key or legend to show that those profit figures are really in the millons of dollars? In this tour, you'll create those necessary metadata trim objects that explain your visualization clearly. |
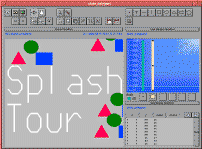 |
Splash
Tour: 30 Minutes
In this tour, you'll use a paint program interface to draw and interact with splash objects. Color, size, visual position and other object attributes can all be associated with data values. No programming required! |
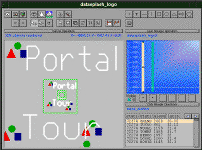 |
In this tour, you will create a portal to another DataSplash visualization. Then you'll click on the portal to go to the new DataSplash visualization. You will also splash the portal to create one portal per table row! |
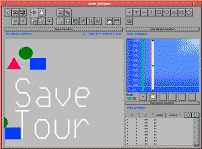 |
DataSplash visualizations share layers which you are allowed to save as separate named entities. You can specify visually which entities to save. In this tour, you'll learn the ins-and-outs of saving and sharing. |