Estimated Time: 30 Minutes
![]()
Tioga DataSplash uses a paint program interface. In this tour, you will use the paint program to create objects whose properties depend on data taken from a database table. Such objects are called splash objects.
The DataSplash visualization in this tour uses data from the weather stations in four western states: Nevada, Utah, California, and Arizona (NUCA). You will create two types of splash objects: triangles and text objects. One triangle and one text string will be rendered for each row in a database table.
This tour assumes you understand the basic navigation model and use of the toolbar as presented in the Quick Tour. However, this tour emphasizes the creation of splash objects and uses only a small number of navigation concepts. It also makes reference to several of the principles in Getting Started; as you are taking this tour, we will tell you when you need to look at this document. Other than that, this tour is self-contained. You should allow approximately 30 minutes to read the introduction and follow the demonstration.
All the tours use the same presentation conventions and definitions. If you have not read it yet, you may wish to look at Section 1 of Getting Started now.
If you have been following the tours in order, you may now wish to open your working canvas. Otherwise, we provide a DataSplash canvas which you can use as a starting point for this tour.
| Sp01 |
Launch DataSplash (and optionally create a working canvas).
If you are using an existing working canvas: If you want to start with the Splash
Tour pre-constructed canvas: You should see the outline of the NUCA states. The title bar of the studio window should reflect your working canvas name. |
 |
DataSplash includes a paint program interface. With this interface, you create and modify objects in the canvas. As in a standard paint program, if you draw an object in the canvas, you have only one copy of it. Such objects are called trim objects. Trim objects are useful as titles, legends, etc.
Unlike a standard paint program, our paint program contains a window (the data manager) that shows rows from a table to be visualized. Each row is assigned an x,y location in the canvas, i.e., the rows are scattered across the canvas, giving an effect similar to a scatter plot (we refer to the location of each row as its x,y position).
At any point, you can select an object in the canvas and duplicate it for every row in the database table. As a result, a copy of the object appears at the x,y location of every row in the table. The effect is like splashing paint across the canvas, coating every scattered row; thus the name splash object.
In this section, you will create a trim object and then change it into a splash object. Since we know that the object you are drawing will ultimately become a splash object, there are several steps we would like you to do before you draw your trim object. In general, these are not mandatory steps, but they are tips about ways to get a visually pleasing presentation.
| Sp02 |
Table-row teleport. When you click on a row in the
data manager, the
camera teleports to the x,y position of that row. (Recall that all
DataSplash canvases have an x,y coordinate system and that these
canvases are viewed from above, as though through a camera pointing at
the canvas.)
Click on the topmost (first) row in the table in the data manager. Although it may not be readily apparent, you should be positioned over the Grand Canyon weather station. The data for this weather station is in the first row of the table in the data manager. (We'll explain in a tip later why this is important.) |
| Sp03 |
Layer manager click zoom. When you click on a tick
mark in the layer manager, you zoom to that percent of the maximum elevation
for the canvas. (Recall that zooming is similar to moving the camera closer
to or further away from the canvas.)
Click on the 8% tick mark in the layer manager. You should see an orange rectangle with the words "Triangle Construction Box". |
| Sp04 |
Enter Select mode. In Select mode, all mouse clicks in
the canvas will be interpreted as attempts to select objects. The Select
button is located in the toolbar above the canvas, on the right side,
and has an icon of a white arrow pointing upward. Note that in Select mode,
all objects except those in the currently selected layer are wireframed.
Click the Select button on the toolbar. The Select button should be depressed. |
| Sp05 |
Select a layer bar. (Recall that objects are contained
in layers. Each bar in the layer manager represents a layer.) All selected
objects turn beige. In this step, you select the layer in which you will
draw the triangle. (When you draw an object, it becomes part of the currently
selected layer.)
Click the fourth layer bar from the left in the layer manager. An icon of a green triangle is on the button positioned immediately below this bar. Be sure to click on the bar - don't click on the button itself! The fourth layer bar should turn the selected color (beige). The triangle icon should turn from green to beige as well. All objects in the canvas should be wireframed. If the triangle icon turns from green to gray, you probably clicked on the layer bar button which contains this icon. If so, click on the button again so that the triangle turns green. Then repeat this entire step (Sp05). |
![]() As a rule of thumb, if
you draw polygons which are fairly large with respect to the canvas at
approximately 10% of the layer manager maximum elevation, the polygons
will look good over the entire 0% to 100% elevation range. Above, we asked
you to zoom to 8% of the maximum elevation because we want the triangles
to look good over the entire elevation range.
As a rule of thumb, if
you draw polygons which are fairly large with respect to the canvas at
approximately 10% of the layer manager maximum elevation, the polygons
will look good over the entire 0% to 100% elevation range. Above, we asked
you to zoom to 8% of the maximum elevation because we want the triangles
to look good over the entire elevation range.
By following the next set of instructions, you will draw a trim triangle.
| Sp06 |
Enter Triangle mode. In Triangle mode, mouse clicking
in the canvas produces trim triangles. The Triangle toolbar button
is located immediately above the canvas and has an icon of a black outline
of a triangle.
Click the Triangle button on the toolbar. Position the mouse cursor over the canvas. The Triangle button should be depressed. The mouse cursor should be a pencil when positioned over the canvas. All objects should change from wireframed to solid. |
| Sp07 |
Paint the triangle.
Starting at the lower left corner of the orange box in the canvas, click on the canvas and drag the mouse cursor to the upper right corner of the orange box. As you drag the mouse, a bounding box should be displayed for the triangle. Roughly line up the bounding box with the orange rectangle. |
| Sp08 | Finish the triangle.
When the bounding box is approximately the same size as the orangle rectangle, release the mouse. You should see a blue triangle inside the orange box. You should be in Select mode (whenever you create an object in the canvas, the system automatically puts you in Select mode and selects the new object ). The triangle you just drew should be selected (there should be nine beige select handles on the bounding box of the triangle). |
Next, you will transform your trim object to a splash object. This means that the trim object will be duplicated for every row in the table associated with the layer. By default, the splash objects look identical for every row in the table.
Recall that each row has an x,y position which is determined by its values in user-specified x,y columns. Each splash object is aligned with the x,y position of its row. Note that we have already established the x,y columns (longitude, longitude respectively) for the layer in which you are about to draw.
In the next set of instructions, you will use the format dialog to edit
your object. Before you can edit an object, it needs to be selected. In
select mode, you can use the ![]() edit
cursor to bring up the Format dialog in which you can set the properties
of the object.
edit
cursor to bring up the Format dialog in which you can set the properties
of the object.
Sp09 |
Select the triangle (if it is not already selected).
Make sure the triangle is selected (beige handles are present). If not, click on the rectangle to select it. Recall you are in Select mode. The beige select handles should be visible. |
|
| Sp10 |
Bring up the Format dialog to edit.
Position the mouse cursor over the blue triangle so that the black edit microscope cursor appears and then click the mouse. The rather large Format dialog should appear. |
 |
Sp11 |
Change an object from trim to splash. Notice that in the Format
dialog there are two radio buttons near the top left. Currently the
Trim button is enabled.
Click the Splash button in the Format dialog. The Splash Wizard dialog should appear. |
 |
| Sp12 | Dismiss the Splash Wizard dialog.
Click the Dismiss button in the Splash Wizard dialog. The Splash Wizard should disappear. |
|
| Sp13 | Dismiss the Format dialog.
Click the OK button in the Fomat dialog. The physical appearance of the triangle should be the same except that it should have shifted position to the center of the canvas. Parts of other blue triangles should be visible as well. The triangle shifted because its x,y position changed when it changed from trim to splash. More specifically, the orange box in which you drew the triangle is centered slightly above the x,y position of the row which describes the Grand Canyon weather station. As a result, when you changed the triangle into a splash object, it shifted slightly downward (to the exact x,y position of the Grand Canyon weather station). |
|
| Sp14 |
Layer manager click zoom to see many splash triangles.
Click on the 50% tick mark in the layer manager. You should see the entire state outline of Arizona. Many identical blue triangles should be scattered about. |
|
![]() When
you turn a trim object into a splash object, the trim object disappears
and is replaced by a number of splash objects. However, the camera will
still be at the location of the trim object, so the splash objects may
not be visible. To make sure you see a splash object as soon as you leave
the format dialog, you can table-row teleport to a splash position and
create the trim object at that location. This is the reason we asked you
to teleport (step Sp02) before you drew the triangle
in the instructions above.
When
you turn a trim object into a splash object, the trim object disappears
and is replaced by a number of splash objects. However, the camera will
still be at the location of the trim object, so the splash objects may
not be visible. To make sure you see a splash object as soon as you leave
the format dialog, you can table-row teleport to a splash position and
create the trim object at that location. This is the reason we asked you
to teleport (step Sp02) before you drew the triangle
in the instructions above.
Besides specifying the x,y position of rows, columns in a table can also be used to specify a splash object's geometry, color, and portal attributes. When you edit a single instance of a splash object, the changes are automatically propagated to all the other instances. For example, when you edit any one of the triangles in your visualization, that change propagates to all the other triangles.
In the following steps, you'll associate the height of the splash triangles with the elevation column in the weather station table.
| Sp15 | Layer manager click zoom to edit a triangle.
Click on the 8% tick mark in the layer manager. You should see a triangle with nine beige select handles in the center of the screen. |
| Sp16 |
Select the triangle if it does not have the beige handles.
Make sure that you are in Select mode and that the triangle is selected (beige handles are present). If not, click on the triangle to select it. The beige select handles should now be apparent. |
| Sp17 |
Bring up the Format dialog to edit.
Position the mouse cursor over the the blue triangle so that the black edit microscope cursor appears and click the mouse. The rather large Format dialog should appear. |
| Sp18 |
Set height to "Function". The Height pop-up menu has
an icon of a thick, light purple line with arrows pointing up-and-down.
Push the Height pop-up menu in the Format dialog, select the "Function" choice and release the mouse. The Height pop-up box should say "Function." The Linear Function dialog should appear. If not, repeat this step. |
| Sp19 | The Attribute pop-up menu in the middle of the Linear Function
dialog contains a list of columns in the weather station table. Set height
to be based on elevation. Then, use a linear function to scale the elevation
field in the weather station table to an appropriate height.
Push the Attribute pop-up menu, select "elevation" and release the mouse. Type "0.008" in the Multiplier text box and "0.0" in the Constant text box. Your function box should look like the example below. |
| Sp20 | Dismiss the Linear Function dialog.
Click the OK button in the Linear Function dialog. The dialog should disappear. The Height pop-up button in the Format dialog should still be labeled "Function." |
| Sp21 | Dismiss the Format dialog.
Click the OK button in the Format dialog. The Format dialog should disappear. The linear function you input is such that the triangle in the center of the screen should not have appeared to change size. However, the other triangles in the canvas should be of different sizes. |
| Sp22 |
Layer manager click zoom to 50%.
Click on the 50% tick mark in the layer manager. You should see the entire state outline of Arizona. There should also be many blue triangles of differing heights scattered about. If for some reason you feel you made a mistake, repeat steps Sp17 to Sp21. |
Associating the height of the triangles with the elevation of the weather
stations gives the splash triangles the appearance of mountains. While
these "mountains" have a height conveniently chosen to be actual
elevations, the "mountain" heights could easily be some other
more abstract number, like average yearly rainfall for the weather station.
A DataSplash user could quickly fly around such a visualization, discovering
the valleys and peaks within the mountain ranges. Upon discerning an interesting
landmark, the user could go data mining in these mountains by drilling
down closer to the canvas.
By default, each splash object is centered on the x,y position of the database row with which it is associated. You can change the alignment point for a splash triangle so it has a different relationship to the x,y position of its row.
| Sp23 Layer Manager Click Zoom |
Layer manager click zoom to edit the triangle.
Click on the 8% tick mark in the layer manager. You should see a triangle with the nine beige select handles in the center of the screen. If not, click on a row in the table window, at which point a triangle should appear. |
| Sp24 |
Select the triangle if it does not have the beige handles.
Make sure you are in Select mode and that the triangle is selected (beige handles are present). If not, click on the rectangle to select it. The beige select handles should be apparent. |
| Sp25 |
Bring up the Format dialog to edit.
Position the mouse cursor over the the blue triangle so that the black edit microscope cursor appears and click the mouse. The rather large Format dialog should appear. |
| Sp26 |
Display the Format dialog advanced options. One row of buttons
in the Format dialog should contain the Color and Alignment
buttons.
Click the Alignment button in the Format dialog. The color options at the bottom of the Format dialog should be replaced with alignment radio buttons. The Center radio button should be enabled. |
Sp27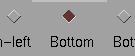 |
Align the bottom of the bounding box of each splash object with the
x,y position of its row.(By bottom, we mean the bottom-middle, as
opposed to the bottom-left or the bottom-right.)
Click the Bottom button in the Format Dialog. The Bottom button should be enabeled. |
| Sp28 |
Dismiss the Format dialog.
Click the OK button in the Format dialog. The Format dialog should disappear. The blue trangle should have shifted so that the bottom-middle of the triangle is at the center of the canvas. |
![]() If you create two splash
objects, they may overlap. To alleviate this kind of splash object clutter,
you can offset splash objects by using the mouse to move them a certain
distance from the table row's x,y position. (This is subtly different
from changing the alignment of the splash objects. Alignment is sensitive
to the differing sizes of splash objects, and therefore does not solve
many clutter problems. Offsets, on the other hand, are constant for all
splash objects and can solve a larger class of clutter problems.)
If you create two splash
objects, they may overlap. To alleviate this kind of splash object clutter,
you can offset splash objects by using the mouse to move them a certain
distance from the table row's x,y position. (This is subtly different
from changing the alignment of the splash objects. Alignment is sensitive
to the differing sizes of splash objects, and therefore does not solve
many clutter problems. Offsets, on the other hand, are constant for all
splash objects and can solve a larger class of clutter problems.)
In the next set of instructions, you will move the splash triangles to offset them from the table row's x,y position (they currently have an offset of 0 in both the x and y dimensions). Realize that when you move one splash triangle, you will move them all since they all have the same offset.
| Sp29 |
Move the splash triangles. There should be a beige handle in the center
of the selected blue triangle. This is the Move handle for the triangle.
Make sure the triangle is selected. Then, position the mouse cursor over the center handle so that the mouse open hand cursor appears, push the mouse, drag the triangle into the orange box and release the mouse. As you move the triangle, a black line appears between the center of the screen and the bottom of the triangle. This line shows the offset between the x,y position of the row and the alignment point of the splash object. |
You are now done editing the splash triangles.
In this section, you will create text splash objects. The canvas we have provided you includes a layer in which you can draw your text. This layer is visible only in the bottom 10% range of the layer manager. This means the text will be visible only when the camera is positioned at a z value below 10% of the maximum elevation of the canvas.
![]() Unlike polygons, text usually
only looks good at low elevations. As a result, it is usually best to put
text objects in layers which are visible only at low elevations.
Unlike polygons, text usually
only looks good at low elevations. As a result, it is usually best to put
text objects in layers which are visible only at low elevations.
| Sp30 |
Layer manager click zoom to a text drawing elevation.
Click on the 4% tick mark in the layer manager. You should see a triangle with nine beige select handles in the center of the screen. |
| Sp31 |
Select a layer bar. In this step, you select the layer in which you
will draw the triangle.
Click the short layer bar which is fifth from the left in the layer manager. It has an icon of a solid black "T" on the layer bar button positioned immediately below the bar. The fifth layer bar should turn the selected beige color. All objects in the canvas should be wireframed. |
| Sp32 |
Enter Text mode. The Text toolbar button is located immediately
above the canvas and has an icon of a black "T".
Click the Text button on the toolbar. The mouse cursor should be a pencil when the mouse is positioned over the canvas. The Text mode button should be depressed. |
| Sp33 |
Paint the text.
Starting at the lower left corner of the blue text construction box, click on the canvas and drag the mouse to the upper right corner of the blue box and release the mouse. You should see the word "Text". (Mouse clicking in the canvas will produce trim text. By default, the trim text is just the word "text.") The first letter "T" should be selected and roughly positioned inside the blue box. Note that, unlike the bounding box for every other type of object drawn in DataSplash, the bounding box for text does not bound the entire object. The bounding box for a text object is associated only with the first letter of the text. |
| Sp34 |
Bring up the Format dialog to edit.
Position the mouse cursor over the the blue triangle so that the black edit microscope cursor appears and click the mouse. The rather large Format dialog box should appear. If the microscope won't appear, make sure the text is selected and repeat this step. |
| Sp35 |
Change an object from trim to splash.
Click the Splash button in the Format dialog. The Splash Wizard dialog should appear. |
| Sp36 | Dismiss the Splash Wizard dialog.
Click the Dismiss button in the Splash Wizard dialog. The Splash Wizard should disappear. |
| Sp37 |
Display the Format dialog text specific options. One row of
buttons in the Format dialog should contain the Color, Alignment,
and Text Specific buttons.
Click the Text Specific button in the Format dialog. The color options should be replaced with text specific options. |
Sp38 |
Set the splash text to display table data. In this step you will set
the splash text object to display the weather station name for each weather
station.
Push the Attribute pop-up menu filled with the text "station_code", select "station_name" from the pop-up list, and release the mouse. The radio button next to the Attribute pop-up menu should be enabled. The Attribute pop-up menu should be filled with "station_name" rather than "station_code." |
| Sp39 | Dismiss the Fomat dialog.
Click the OK button in the Format dialog. The Format dialog should disappear. The word "Grand" should be visible on the canvas and the letter "G" should be centered in the canvas. |
This completes the construction part of this tour.
Congratulations! You have successfully completed your splash objects.
In the next tour, the ![]() Portal
Tour, you will create an even more interesting visualization by creating
splash portals. Like the text you just created, these portals will be visible
only at lower elevations. These portals will show bar charts about weather
station temperature data, thus providing more information and detail.
Portal
Tour, you will create an even more interesting visualization by creating
splash portals. Like the text you just created, these portals will be visible
only at lower elevations. These portals will show bar charts about weather
station temperature data, thus providing more information and detail.
You may now want to save your changes to your working canvas for use in the next tour.
| Sp40 |
Enter Click Pan mode. When you are in Click Pan
mode, clicking on a pixel in the canvas moves the canvas camera to
center on that pixel. The Click Pan toolbar button is above the
layer manager and has an icon of a white arrow pointing upward to the left
positioned next to a white cross.
Click the Click Pan button on the toolbar. The Click Pan button should be depressed. All objects in the canvas should be solid (as opposed to wireframed). |
|
| Sp41 |
Use the Home button to return to camera start.
Click the Home button on the toolbar. Your visualization should look similar to the screen shot. |
 |
| Sp42 | Table-row teleport (Sp02).
Click on the topmost (first) row in the data manager table. Although it may not be readily apparent in the canvas, you should be positioned over the Grand Canyon weather station, which is the first row in the weather station table in the data manager. |
|
| Sp43 | Layer manager click zoom.
Click on the 8% tick mark in the layer manager. Your visualization should look similar to the screen shot. |
 |
| Sp44 | Save your working canvas. If you are happy with your work,
then you may want to save your working canvas to use for the If you are saving your working canvas: You are now ready to exit the program. |
|
| Sp45 | Exit.
Do the steps in Section 6 of Getting Started to exit. The DataSplash windows should be gone. |
|
In this tour you have learned how to create splash objects. You have set the attributes of splash objects to depend on database data. You have learned some of the issues involved in drawing objects at different elevations.
Thank you for taking this tour of DataSplash.
![]()